
Is There An AI Bubble?
Apparently Not

One of the biggest questions in markets right now is whether there is a huge AI bubble that is primed to pop at any point.
Whether there is a bubble or not is actually quite a tough question.
Lofty valuations are sometimes held up as a sign that there is one, for instance with the S&P 500 forward price to earnings ratio up well above its long-run averages (chart below).
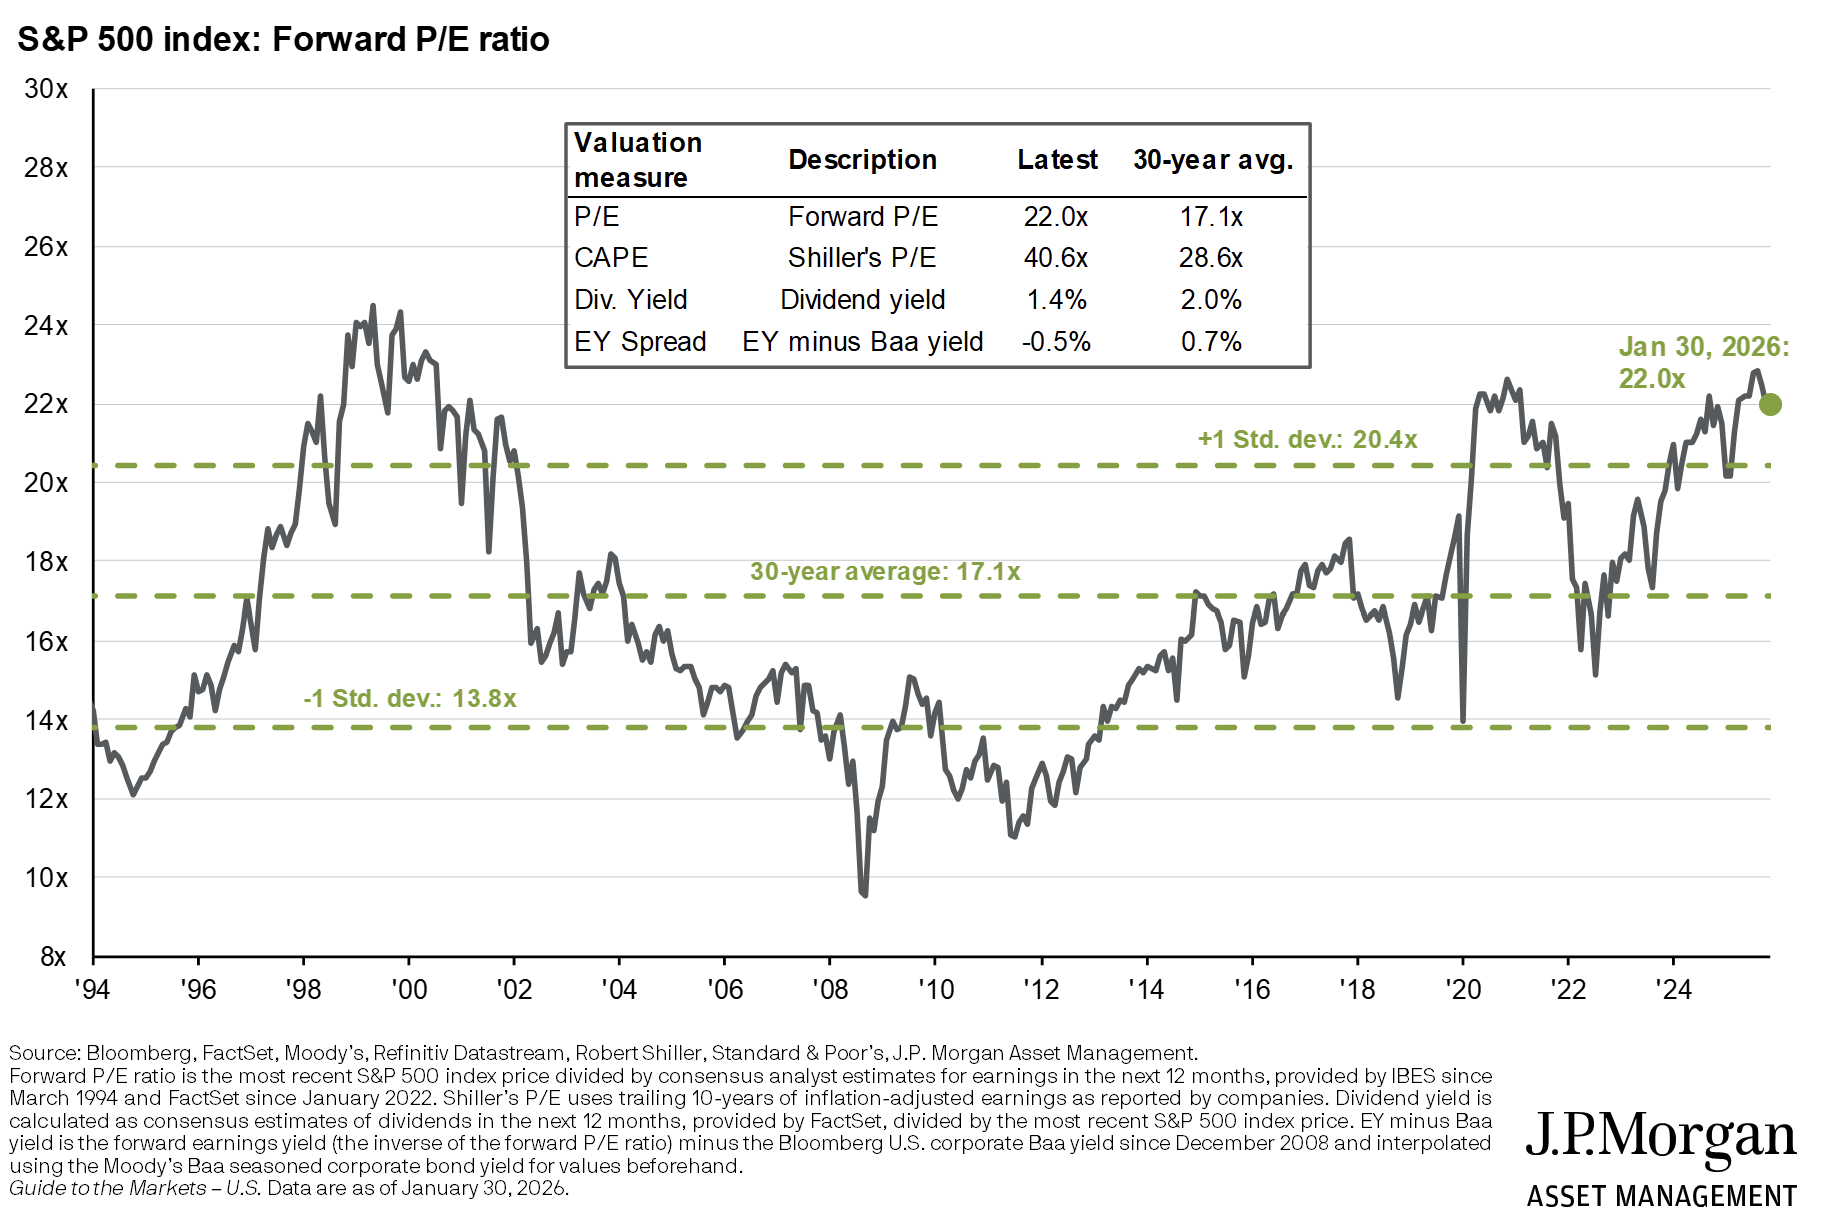
However, the glaring problem with using measures such as the forward P/E ratio is how they handle expectations for future earnings growth. The forward P/E ratio only explicitly considers expected earnings for the next 12 months, with any earnings for the following period lumped into the multiple. This means the outlook for profitability could clearly be strong in year 2 of the forecast, for example due to very rational reasons such as the macro cycle or secular themes, but this would just lumped into the multiple, pushing it higher.
That said, we cannot just say xyz P&L derived multiple is significantly different from a long-run average, so there is a bubble.
How can we identify a bubble then?
It’s best to start with a definition, and according to Investopedia:
A bubble is an economic cycle that is characterized by the rapid escalation of market value, particularly in the price of assets. This fast inflation is followed by a quick decrease in value, or a contraction, that is sometimes referred to as a “crash” or a “bubble burst.”
A bubble usually forms when asset prices surge due to highly optimistic market behavior. During a bubble, assets typically trade at a price, or within a price range, that greatly exceeds the asset’s intrinsic value (the price does not align with the fundamentals of the asset).
This indicates we can assess whether there is a bubble by ensuring that asset prices do not greatly exceed their intrinsic value due to highly optimistic market behaviour. The big question here is how do you determine the intrinsic value when there is huge uncertainty in what the future looks like? The AI narrative offers potential for big future profits for some firms if it delivers, while there is every chance that it could underwhelm severely, troubling the profitability outlook of those same firms.
In this instance, checking whether equities are close to some estimate of their intrinsic value shifts to two main questions. First, whether investors are rationally assessing the projected future profits for individual companies in different possible scenarios (for AI). Second, whether investors are rationally assessing the likelihood of each of these scenarios.
To take one example of this, we built a small financial model for AI darling Oracle. Software stocks have had a rough 12 months (chart below), but hype is still quite significant. Meanwhile, a new scenario for investors to rationally price (AI driven vibe coding steals a significant amount of the earning potential) has emerged, which may not be being rationally priced. For some, there is still clearly a bubble, but is that true?
To assess this, we postulate a few different trajectories for Oracle’s revenue growth under a variety of scenarios for AI (chart below). These encapsulate an AI fails bear case (which might also cover a vibecoding kills Oracle’s growth prospects scenario), and scenarios for three different varieties of AI success. As a side note, some AI maximalists might say the revenue projections under even the AI utopia scenario are too low, to which I would say we at least need to make some effort to ground the exercise in reality :)
With the revenue projections in place, we drive out the rest of the simplified income statement using some pretty uncontroversial assumptions. COGS are a set percent of revenue based on recent history, operating expenses are growing at a fixed rate similar to recent history, non-operating income remains around its recent averages, and taxes are set as a percent of pre-tax income based on historic averages by quarter. This means that COGS and taxes adjust with our different scenarios for revenue, whereas operating expenses and non-operating income are fixed under the different scenarios.
With this, we find earnings as:
Net income = revenue – COGS – operating expenses + non-operating income – taxes
Under our different scenarios, we find annualised (4Q summed) earnings as below. For context, Nvidia had net income of USD120bn in FY2025, meaning in our upside scenarios, come 2035, Oracle could be among one of the most profitable firms on the planet.
In order to convert these estimates of earnings to an estimate of market cap, we discount the stream of quarterly earnings through 2039 to present day using a discount rate, which we loosely estimated as 10.4% using the CAPM (RF rate of 4.5%, beta of 1.3, ERP of 4.5%, all ballpark estimates). We also discount to present day our estimate of the terminal value of the firm at end-2039, estimated using the Gordon Growth estimate. Summing the PV of the sum of earnings and the PV of the terminal value gives estimates of market cap under the different scenarios.
For instance, in our AI kinda delivers scenario, the sum of earnings through 2039 in PV terms is USD328bn and the PV of the terminal value at end-2039 is USD52bn, giving a market cap estimate of USD380bn.
This is shy of the current market cap of USD530bn, but we are yet to capture the uncertainty in just which scenario we are in here. In the table below, we take our estimates of market cap under the four different scenarios, and probability weight these by what might be reasonable estimates of the likelihood of each scenario:
Probability weighting each scenario by 25%, we find a market cap of USD743bn; however, instead, if we use weights that reflect a potentially realistic assumption of the probabilities of the different scenarios (scenario 2 column), we find a market cap of USD534bn, roughly in line with the current market cap.
So, while you can dispute the revenue growth figures, probabilities, and other assumptions that we have used, we have shown that there is a rationale framework to derive the current market price of Oracle. By this measure, we are not in an AI bubble.
However, that is not to say there are not some stocks which are clearly bubbles. For instance, SpaceX IPO’d on Thursday, hitting a market cap of USD2.1trn by Friday’s close.
Above, we noted that Oracle’s net income could easily hit somewhere in the USD100-200bn region come 2039 under some sort of AI delivers scenario. In contrast, our model suggests that in order to hit a similar level of profitability, SpaceX would need to grow its revenue by around 25% annually, every year, through to 2039 (and keep costs under control too, with net income falling to -USD4.9bn in 2025).
And even this revenue growth would only be to hit Oracle’s projected profitability, while Oracle is trading at roughly a quarter of the valuation of SpaceX.
Revenue growth that would justify SpaceX’s current market cap would need to be much higher. Even if we have revenue growth averaging 30% y-o-y through 2039, that would only justify a market cap of just over USD700bn, leavings USD1.4trn of market cap left to be explained in earnings growth from 2040 onwards (captured for Oracle in its terminal value). This residual is set to be made up by those Elon Musk promises, which would need to come through for SpaceX investors.
JB Macro is my blog, where I splurge out my brain. I’m building a following for my passion, writing about economics and markets, and it would be really great to have you on board. Please consider pressing the subscribe button below. Thank you, James.
This newsletter is for informational purposes only. It does not constitute investment advice or an offer to invest. The views expressed herein are the opinions of JB Macro exclusively. Readers should conduct their own research and consult with professional advisors before making any investment decisions.
The paradox in this piece is that "no AI bubble" and "SpaceX is clearly a bubble" are both conclusions in the same article, and both are correct simultaneously. The bubble question was never a binary one at the asset class level. It is a valuation dispersion question within the asset class, and the Oracle versus SpaceX comparison makes that dispersion visible in a way that forward P/E ratios cannot.
The scenario-weighting methodology is the most useful contribution here. A 25% probability assigned to each of four scenarios for Oracle produces a market cap close to current pricing. That is not confirmation that the stock is cheap, it is confirmation that current pricing is internally consistent with a rational probability distribution. What the 71.4% IT overweight in the June consensus does not capture is which names within that overweight pass the same rationality test and which require scenario assumptions that are difficult to defend.
A rational price and a safe price are not the same thing. Oracle may be the former without being the latter.