
Consensus & Market Pricing Do Completely Different Things
Stop Asking Stupid Questions

Since the beginning of 2026’s global energy shock, I’ve been asked some variety of the following question numerous times:
Why is your base case for the BoE/ECB/Fed so much lower than market pricing?
Why is consensus on xyz central bank so much lower than market pricing?
This often seems to be levelled as a sort of accusation that my own views or the consensus view (of many economists per aggregators like Bloomberg) is not facing up to the reality that markets are aware of, regarding either how bad the energy shock is or just how much central banks will have to do in response.
The answer to these questions is that markets and economists/consensus do completely different things.
As an economist, I spend my time focussing on distinct scenarios for growth, inflation, GDP etc. I consider how things look in different risk scenarios, but generally I focus on a base case, i.e. the outcome that I think is the most likely. Consensus is just an average of a bunch of economists base cases.
For example, my base case is for the BoE to remain on hold for the rest of 2026 and to cut twice in 2027. I think risks in 2026 bias to the upside (on a more extreme energy shock or signs of more sticky inflation) and if we don’t get see those risks materialise in 2026, then I think risks bias to the downside in 2027 (there are already signs of strong underlying disinflation and aggregate demand could remain weak).
However, markets are doing something fundamentally different.
One of the most useful frameworks we have consistently used to understand market prices is expected value (e.g. here and here), where we think of the price of an asset as equal to its probability weighted value. i.e. its price is equal to the sum of the probability of all possible scenarios that can happen multiplied by the value of the asset under each scenario. Or, for scenarios i:

Through this framing, we can see that markets are not just considering the most likely outcome as consensus is doing. They are incorporating the impact on prices of less likely scenarios too.
We can demonstrate this quite easily. Taking my example from before, let’s lay out three hypothetical paths for Bank Rate, with subjective probabilities of them playing out. We have a base case (red line), more hawkish, and more dovish outcomes, on a quarterly basis:
Let’s say that markets completely agree with us on our scenarios, where Bank Rate will be in each of them, and their probabilities. To figure out where rates need to be priced, we turn to our expected value formula. For example, for Q426 there is a 50% chance of Bank Rate at 3.75% (base case), 30% chance of Bank Rate at 4.50% (hawkish), and 20% chance of Bank Rate at 3.50% (dovish). That means the appropriate Bank Rate which would need to be priced for Q426 is:
50% x 3.75 + 30% x 4.50 + 20% x 3.50% = 3.93%
This means that even with the identical views, markets are pricing in almost an entire extra hike than our base case (3.75%). Here are the full trajectories for our base case vs market pricing, with our illustrative market pricing consistently above our base case:
We can also see this empirically. The Bank of England regularly surveys market participants on a variety of topics, including expectations for Bank Rate. For the last survey, covering July 15-17, here are market participants median expectations for Bank Rate:
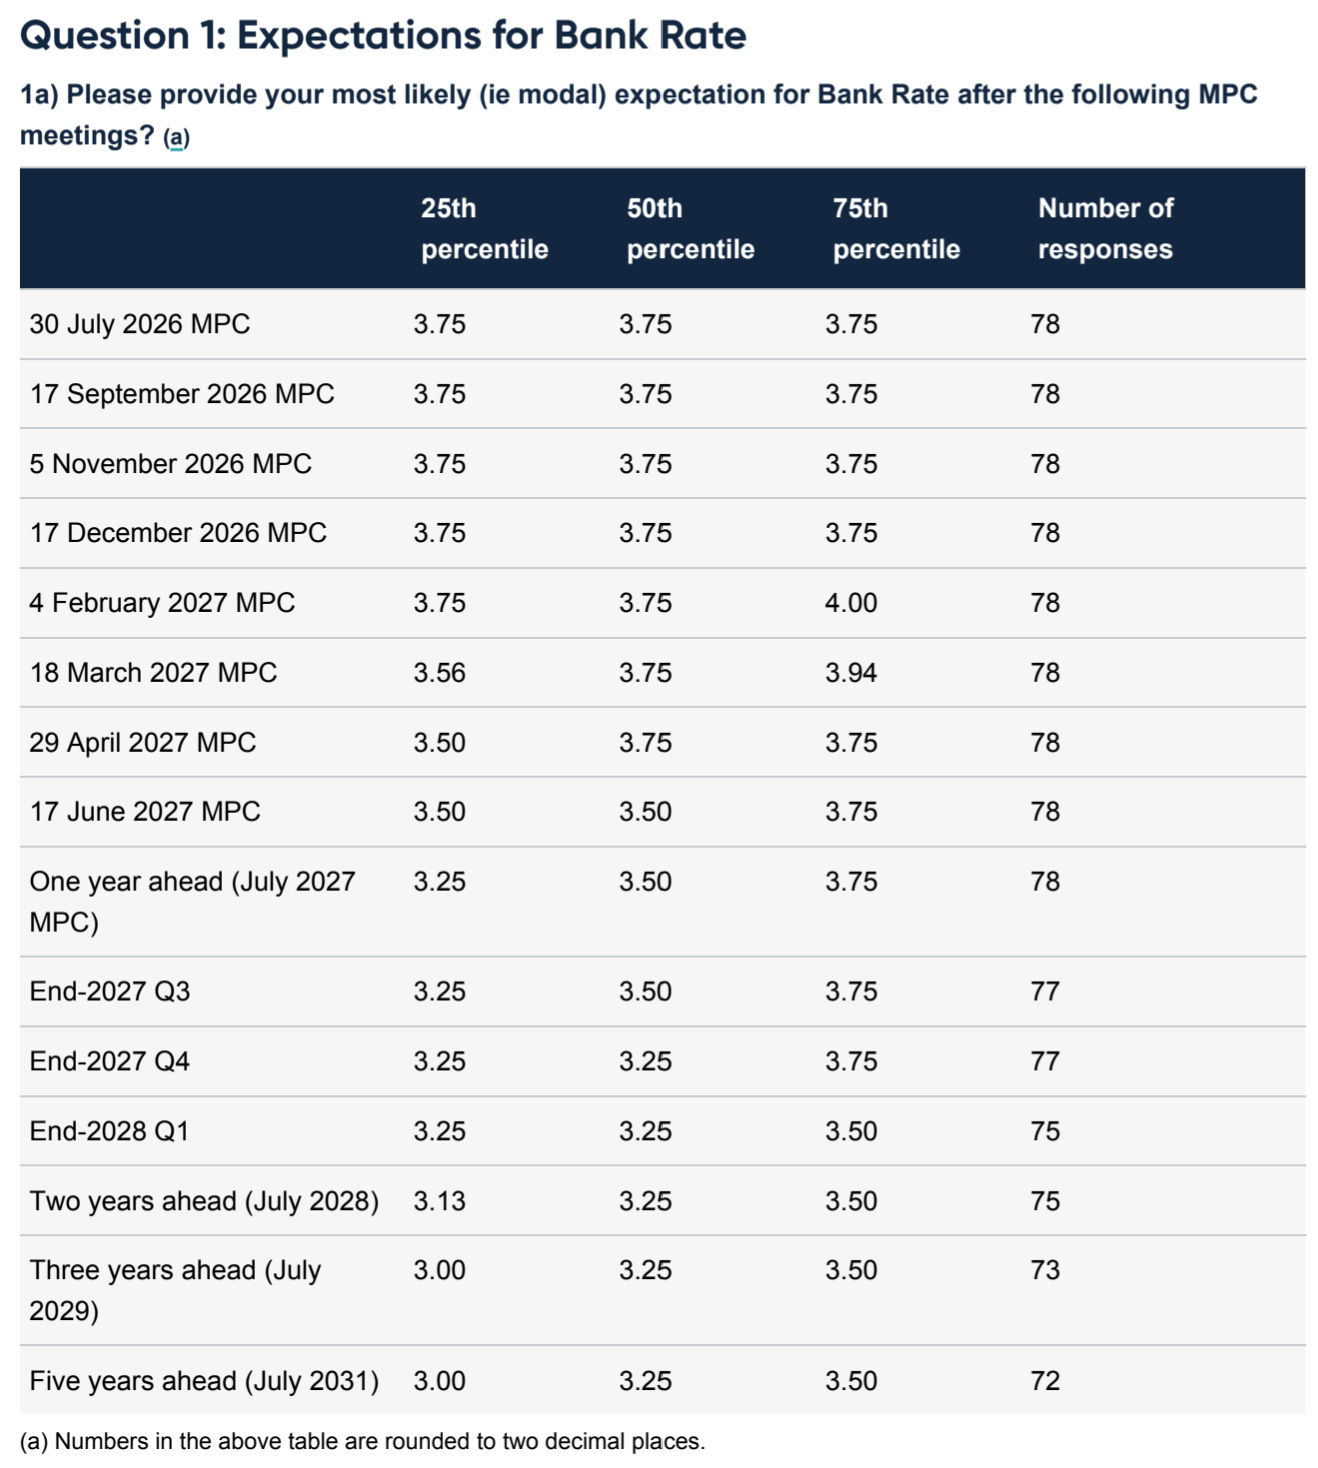
Over the same period, market pricing for end-2026 Bank Rate came in at 4.16% and for end-2027 at 4.24 (3M SONIA STIRs). These are both well above even the median respondent of the 75th percentile.
This is because in the survey data, traders were asked to do the same thing economists do all the time – provide a base case.
So there you have it. Stop asking analysts why their base case is different to market pricing. They do completely different things.
JB Macro is my blog, where I splurge out my brain. I’m building a following for my passion, writing about economics and markets, and it would be really great to have you on board. Please consider pressing the subscribe button below. Thank you, James.
This newsletter is for informational purposes only. It does not constitute investment advice or an offer to invest. The views expressed herein are the opinions of JB Macro exclusively. Readers should conduct their own research and consult with professional advisors before making any investment decisions.
Reading across 69 asset manager reports each month, our overweight/underweight split has the same base-case problem you're describing: each manager states a modal view, and averaging 69 modes isn't the same statistical object as one probability-weighted expected value.
That's likely part of why consensus positioning and market pricing diverge even when nobody disagrees on the scenarios, only on how much weight the tails deserve.
Your BoE example isn't traders being more hawkish than consensus, it's proof the two numbers were never measuring the same thing.