
Essential Reading From June 26
All The Good Macro I Read In June 2026

In this note, we outline the noteworthy macro we read in June, with our summaries. The full reading list is updated regularly here.
Semiquincententacles – JPM’s Eye On The Market (research note), June 2026: Read this from Michael Cembalest. It’s soo good for US macro. But if you don’t, here are several key extracts:
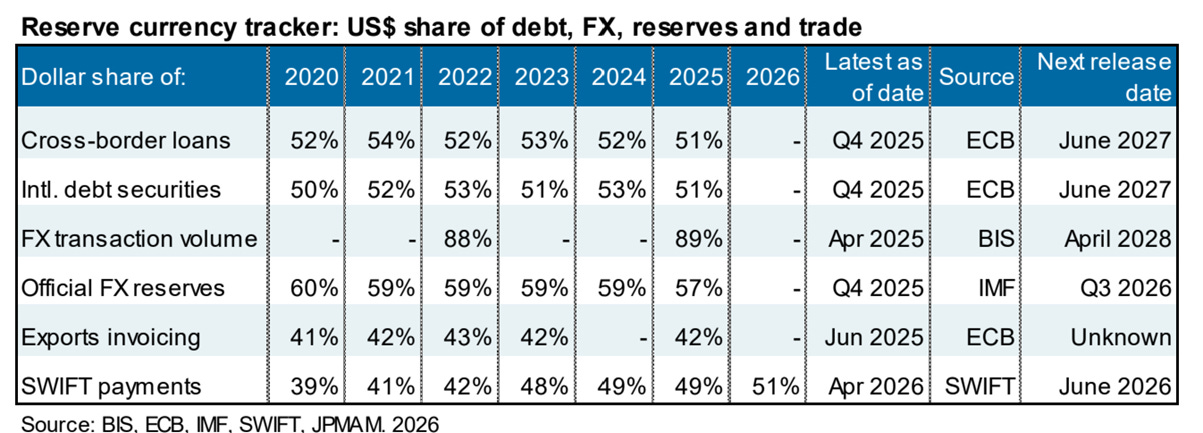
I’m not surprised by the dollar’s resilience: the six metrics we track regarding the dollar’s reserve currency status are mostly stable: the dollar’s share of cross border loans, international debt securities, foreign exchange volumes, FX reserve asset allocation, export invoicing and SWIFT payments. The dollar share of FX reserves has declined by 3% since December 2020 but the offsetting increase has entirely been in the IMF’s “other currency” category which includes the Singapore Dollar, Korean Won, Swedish Krona, Norwegian Krone and others. FX reserve shares for the Euro, Yen, Pound and Chinese RMB have declined since that date.
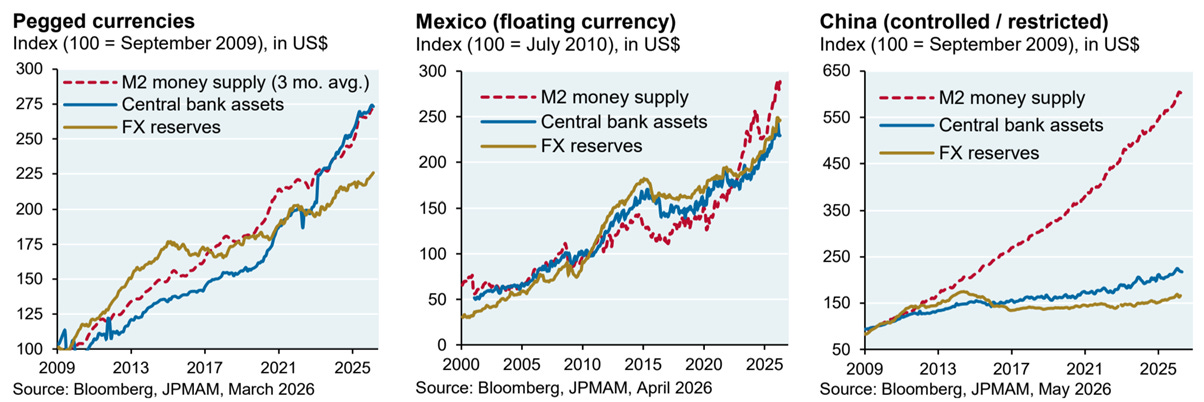
… My colleague Alex Wolf has done some insightful analysis on this topic. As shown below, FX reserves, central bank assets and money supply usually move in sync, whether we’re looking at fixed currency pegs 5 or a floating currency like the Mexican Peso; otherwise there would likely be an adjustment through a decline in the exchange rate or a balance of payments crisis. China is different: there’s a huge disconnect between its soaring money supply and much slower growth in FX reserves and central bank assets. The reason: money creation is essentially out of the central bank’s control. This arrangement may only be sustainable when accompanied by a closed and highly regulated capital account, which is entirely inconsistent with reserve currency status.
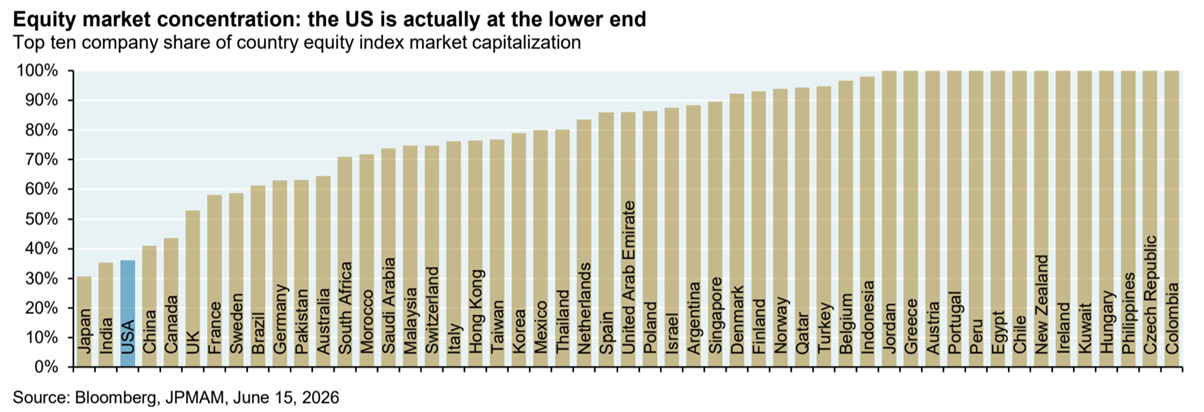
… As recently as 2015 the 10 largest US stocks represented just 17% of S&P 500 market cap; that was also the level that prevailed during the mid-1990’s. Now this figure has risen to ~40%. This might surprise you, but 40% concentration still ranks among the three lowest equity concentration figures in the world; only Japan and India have less. Increased concentration creates risks and challenges for asset allocators, but it’s important to put US equity market concentration in a global context.
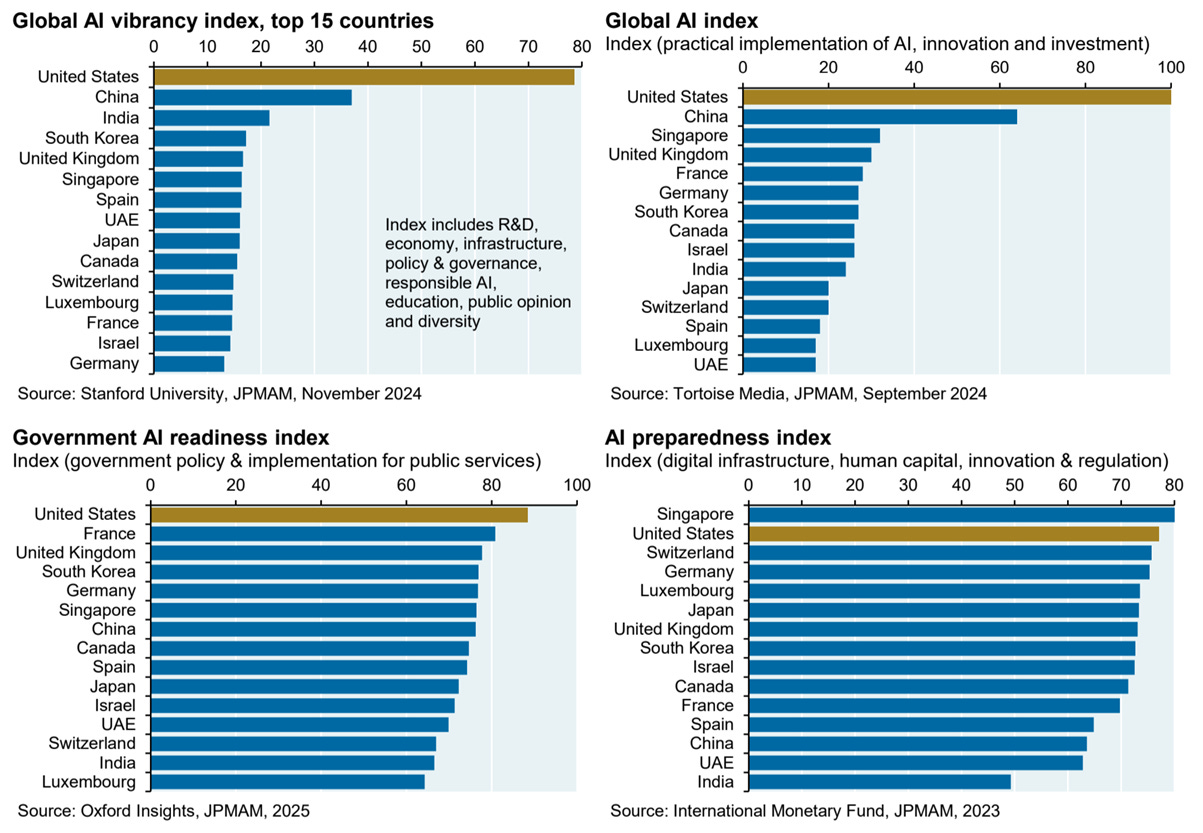
… The charts below show measures of AI readiness from four different sources. They all point to the same conclusion: the US is the most vibrant and prepared country for AI, with China close behind on some measures.
Keep reading with a 7-day free trial
Subscribe to JB Macro to keep reading this post and get 7 days of free access to the full post archives.